Turbo RSI Trend Trading System
Vendor : TradeStudio
Notes : Once you subscribe to the Product. Our support team will reach out you within 24 hours to facilitate the installation of the necessary licenses and software. Feel free to contact us via email (support@traderskart.in) or call us at (+91 8550 828 828) for any further assistance or services you may require.
Only logged in customers who have purchased this product may leave a review.
Description
Turbo RSI Trend Trading System uses Turbo RSI (responsive indicator) as a base input to predict short-term trends with adjustable stop loss controls.
Trading System Type: Positional
Supported Software: Amibroker (32-Bit) – 6.0+ or higher version
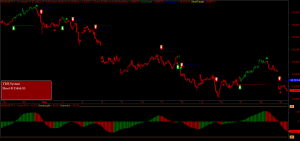
What is a Trend Following System?
According to Wikipedia, Trend following or trend trading is a trading strategy in which one should buy an asset when its price trend goes up, and sell when its trend goes down, expecting price movements to continue.
Traders who employ a trend-following strategy do not aim to forecast or predict specific price levels; they simply jump on the trend (when they perceived that a trend has been established with their own peculiar reasons or rules) and ride it.
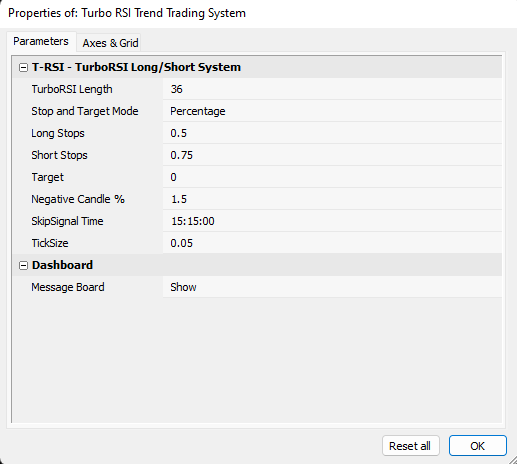
Parameter Settings
Backtesting Performance
In order to test the system parameters following parameters are used
| Parameters | Value |
| Trading Instrument | Bank Nifty Futures |
| Backtesting Timeframe | 15min timeframe (Continous Data) |
| Backtest Length | Jan 2011 – May 2022 |
| Strategy Type | Volatility-based Trend Following |
| Position Size | 1 Lot |
| Slippage + Commissions | 0.02% |
| Trading Capital | RS 2,00,000 |
| Current Trading Margin as of 6th Aug 2021 | Rs 1,50,432/Lot or 15.48% NRML Margin |
| Execution Type | Market Order |
| Long Stoploss | 0.5% |
| Short Stoploss | 0.75% |
| Signals in Futures and Execution in Options | Yes Possible |
| Which Option Strike to Select | 4 Strike ITM (Ensure Sufficient Liquidity is available) |
Rough Theoretical Brokerage Charges involved in a typical Buy and Sell Transaction with Bank Nifty at 35,000 levels
| Parameters | Value |
| Total Turnover | Rs 1750000 (Buy Side + Sell Side) |
| Brokerage | Rs 40 |
| STT total | Rs 88 |
| Exchange txn charge | Rs 35 |
| Clearing charge | RS 0 |
| GST | Rs 13.5 |
| SEBI charges | Rs 1.75 |
| Stamp duty | RS 17.45 |
| Total Charges | Rs 195.75 (0.011%) |
| Points to breakeven | 7.83 points |
Backtesting Results
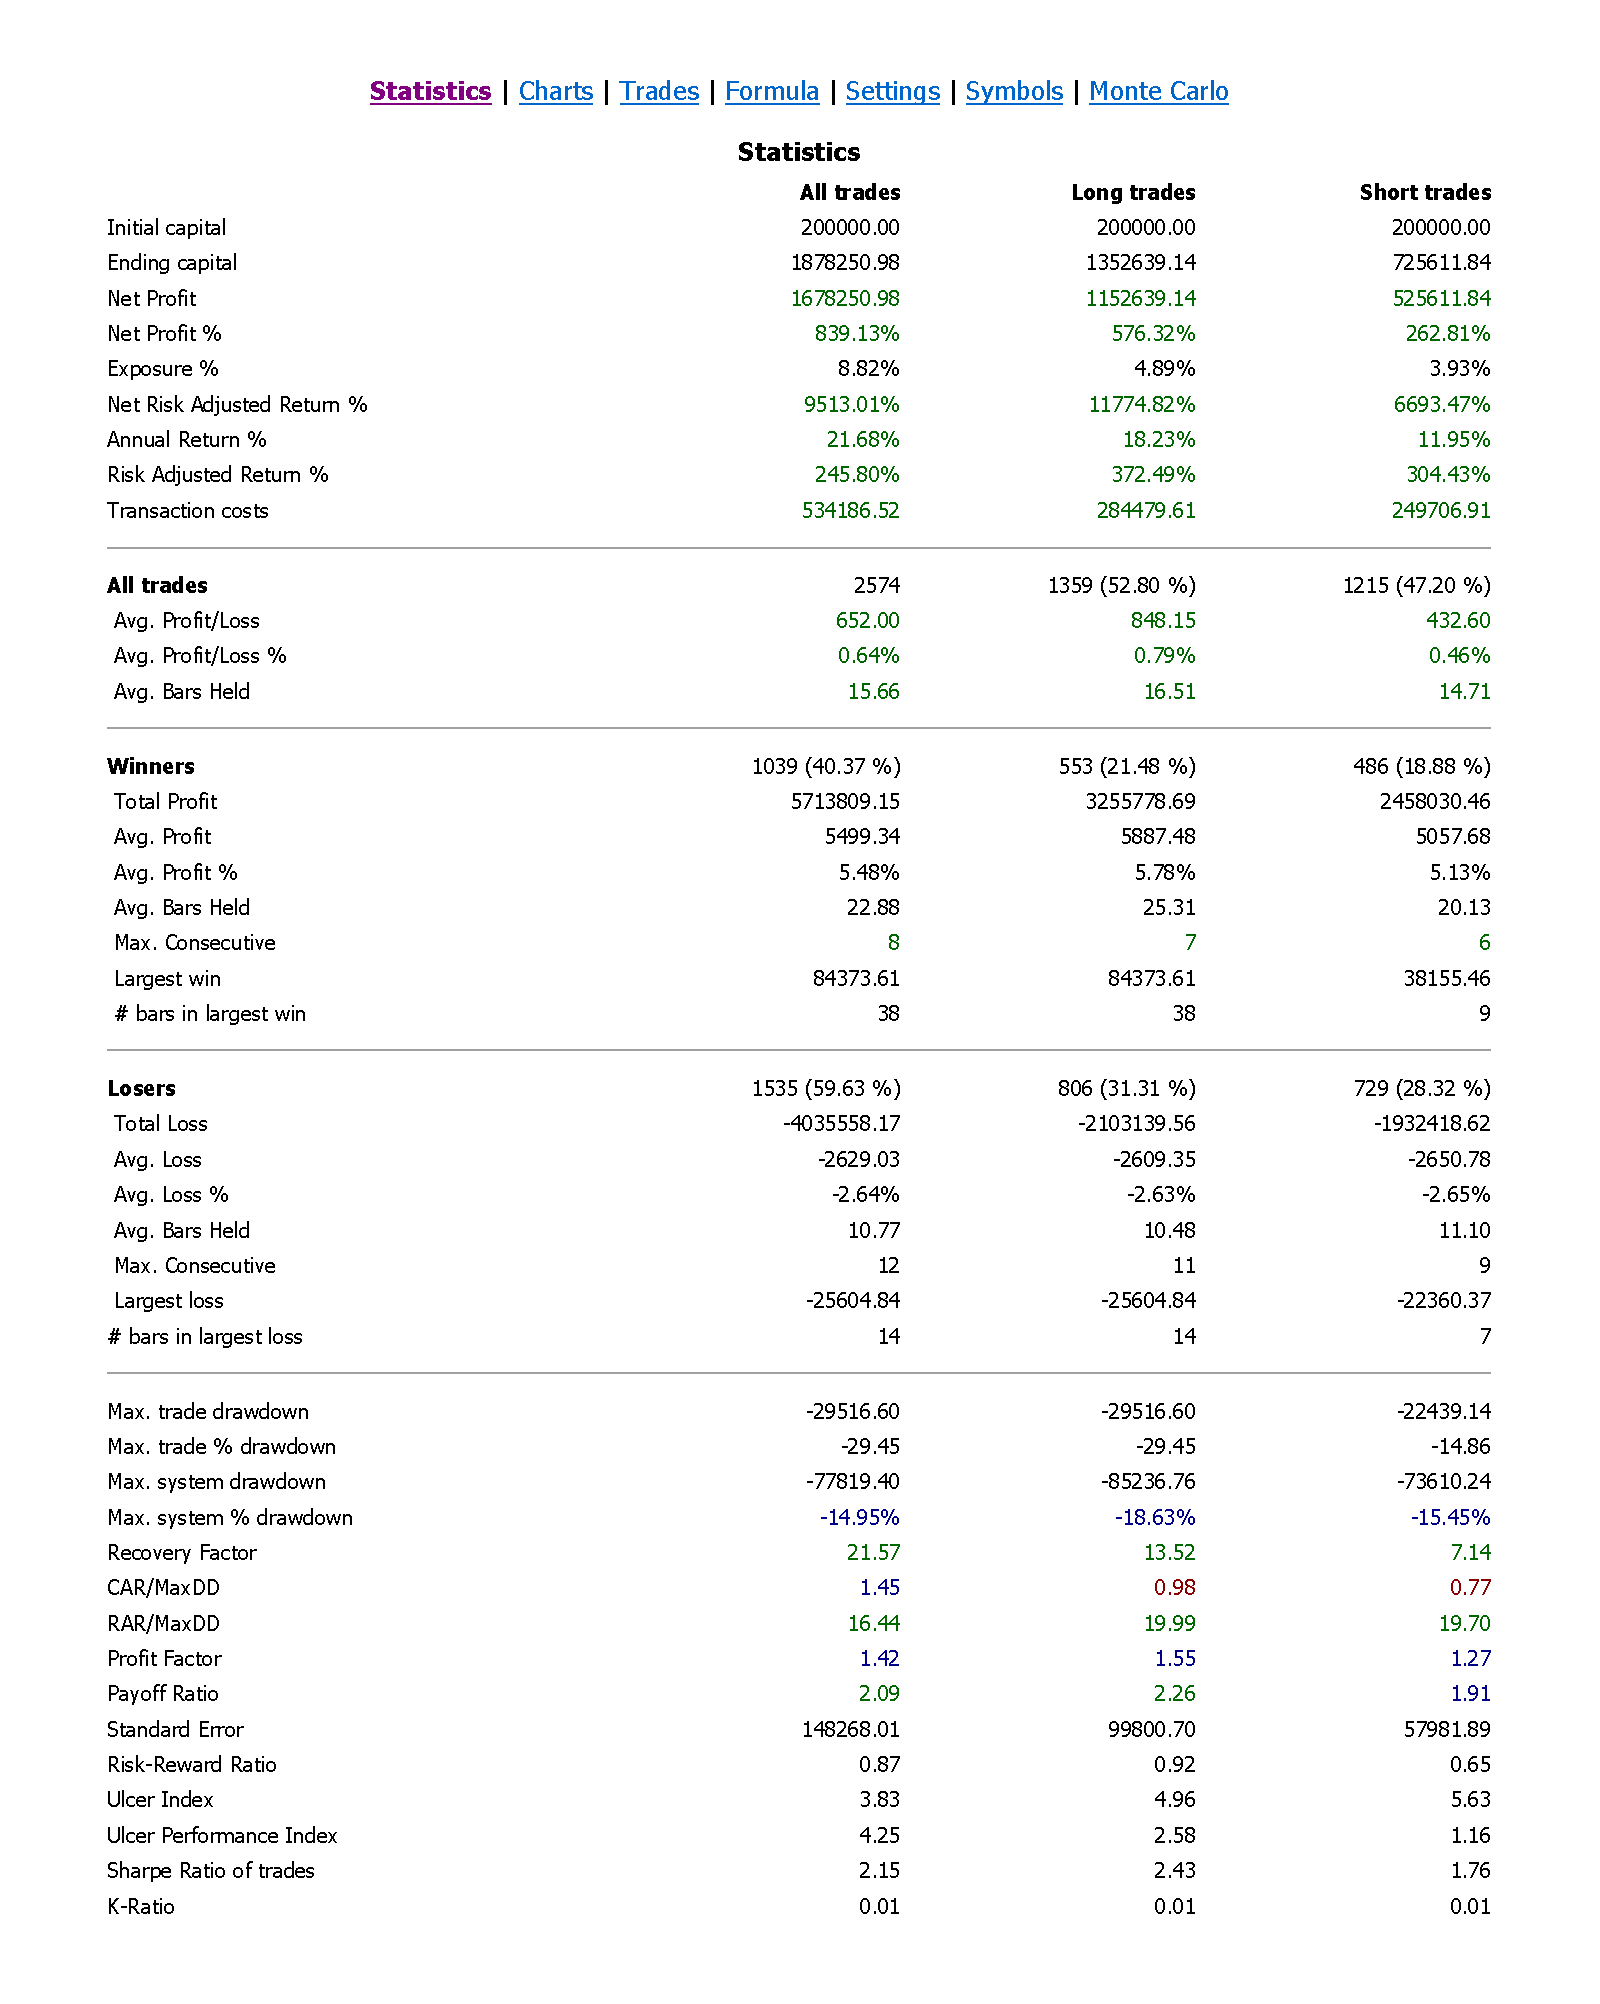
Turbo RSI Trend Trading System – Complete Backtesting Report
Key Backtesting Performance Metrics
| Key Performance Metrics | Value |
| Sharp Ratio | 2.15 |
| Max System Drawdown | 77819/Lot (UnHedged Risk) |
| Calmar Ratio (CAR/MDD) | 1.45 |
| Recovery Factor | 21.57 |
| Profit Factor | 1.42 |
| Payoff Ratio | 2.09 |
| Risk-Reward Ratio | 0.87 |
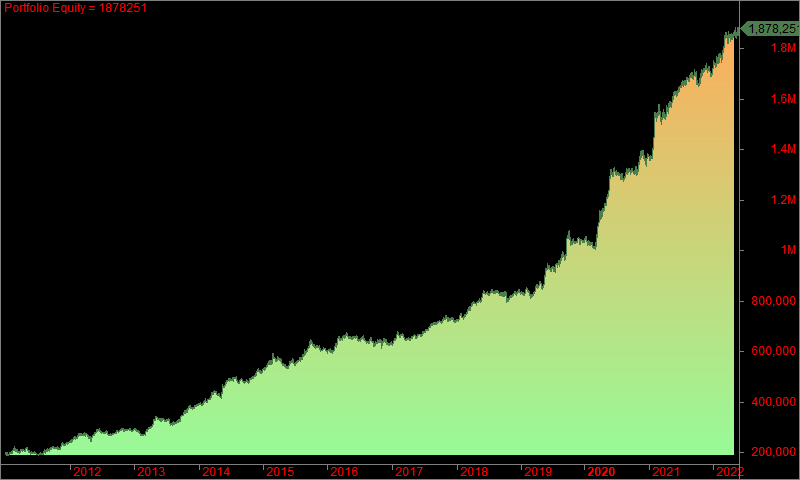
Equity Curve
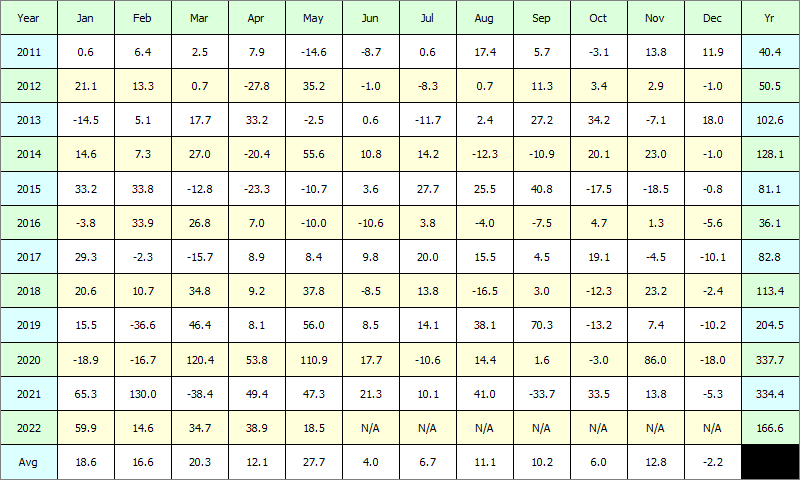
Absolute Profit Table (In Thousands)
Additional information
| Months | 1 Month, 3 Months, 6 Months, 1 Year |
|---|







Reviews
There are no reviews yet.